 Polski
 English
![]() metaBIAL – on-line simulator enabling comparison of efficacy of different therapy options in patients with previously untreated B-cell chronic lymphocytic leukemia in respect to the progression free survival and the overall survival.
metaBIAL – on-line simulator enabling comparison of efficacy of different therapy options in patients with previously untreated B-cell chronic lymphocytic leukemia in respect to the progression free survival and the overall survival.
Description & Graphics
A few therapy options are currently available for symptomatic, progressive chronic lymphocytic leukemia (CLL) that make use of alkylating agents (e.g. chlorambucil, bendamustine), purine nucleoside analogues (e.g. fludarabine), and / or monoclonal antibodies (e.g. alemtuzumab, rituximab) either in a monotherapy or in a combination therapy. Efficacies of some of these treatments for symptomatic previously untreated CLL patients have been compared directly in the randomized control trials (RCTs) in terms of the progression-free survival time (PFS) and / or overall survival (OS). However, the available data are sparse and most of the therapy options have not been compared directly.
The objective of the metaBIAL on-line simulator is to enable comparison of efficacy of different therapy options in patients with previously untreated CLL in respect to PFS and OS. The predicted survival courses are based on models of hazard functions of competing interventions that make use of the first order and the second order fractional polynomials. The models used in the metaBIAL simulator were selected from a broad family of parametric survival functions including some of the commonly used (e.g. Weibull, Gompertz) and it does not rely on the constant hazard ratio assumption.
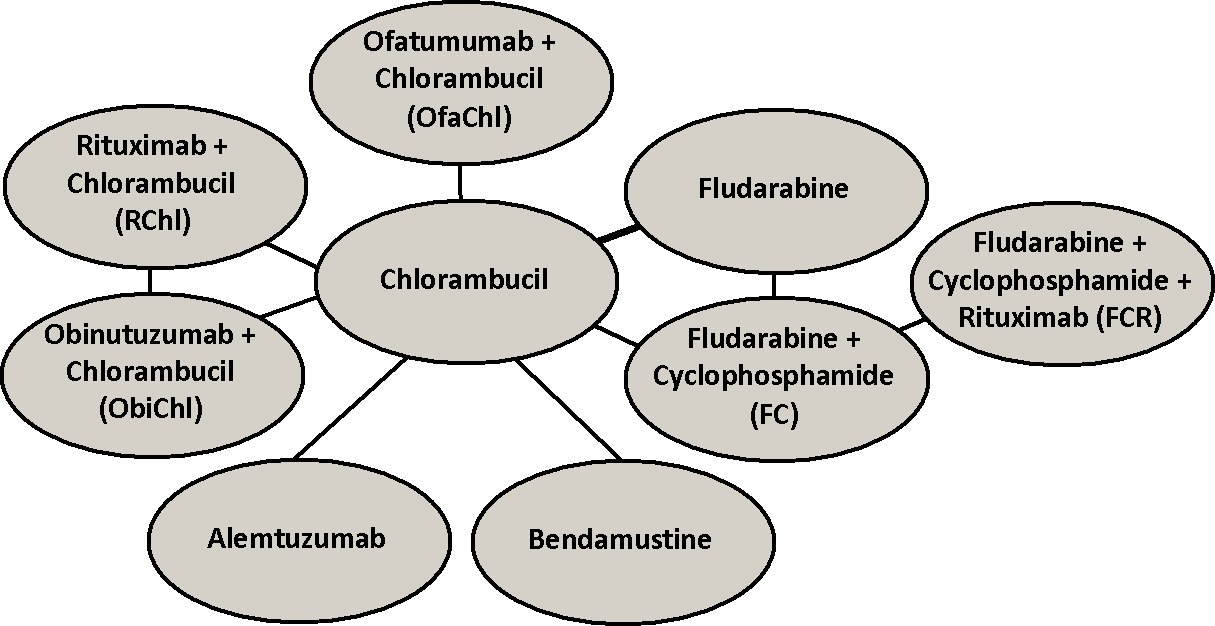
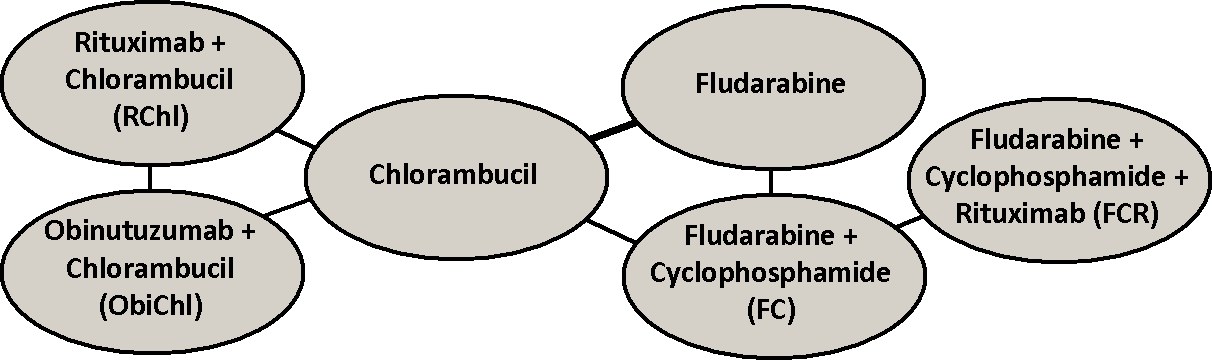
A literature search was conducted in the NCBI PubMed and Cochrane Library for RCTs databases for studies published in the English language before January 2014 using search terms that included names of drugs used as primary agents in CLL therapy that we identified as the first-line therapy options for CLL using National Comprehensive Cancer Network (NCCN) Clinical Practice Guidelines. In the search query also terms “CLL”, “drugs” and “treatment” were included. References of the identified papers were used to search for additional eligible studies. As a result, 467 studies were found that were either reported in papers containing the searched terms or that were referenced in these papers. For each study identified, the title and abstract were analyzed to exclude studies that described one drug, reported results of non RCT or concerned not treatment naïve patients. Then the main text of the identified papers was checked to include studies that measured a survival endpoint (PFS and / or OS), provided respective survival curves and reported the number of patients at risk below the survival curves at different times during follow-up. Finally, 9 RCTs [1-9] were identified for PFS analysis and 6 RCTs [1-6] for OS analysis. The resulting networks are shown below for PFS and OS, respectively.
In the metaBIAL simulator a multi-dimensional treatment effect approach was used as an extension of a network meta-analysis, in which the treatment effect is represented by a single parameter [10]. The hazard model represented with several parameters defined using first and second order fractional polynomials was applied. In this model, for the simplest case of the first order fractional polynomial, the log hazard (hAt) of treatment A at time t is given as [10]:
ln(hAt) = b0A + b1A tp with t0 = log(t)
If we use the first order polynomials for a single RCT comparing two treatments (A and B), parameters of the model for treatment B are given as:
b0B = b0A + d0 and b1B = b1A + d1
where vector (d0 d1) reflects the difference in b0 and b1 of the log hazard curve for treatment B relative to A.
Meta-analysis models for the comparison of treatment B versus A can be extended to models allowing simultaneous comparisons of B vs. A as well as C vs. A. When individual pair-wise trials are comparable in terms of covariates affecting the relative treatment effect then a network of studies can be built using trials with common arms to allow for both direct and indirect comparisons preserving the strength of randomization. In a network meta-analysis of a binary outcome an indirect estimate for the relative effect of C vs. B (dBC) can be obtained from the direct estimates of A vs. B and C vs. A using the following equation:
dBC = dAC – dAB.
For a network meta-analysis of survival data, the comparison of treatments is performed on the log hazard ratio (HR), and the following relation should apply to every timepoint t:
ln(HRBC(t)) = ln(HRAC(t)) – ln(HRAB(t))
HRBC(t) reflects the hazard ratio of C relative to B at time t. Hence, in the fractional polynomial log hazard model the differences in the model parameters b0 and b1 are independent of time and these differences for the B vs. C comparison can be described by the differences in b0 and b1 for the A vs. C comparison and A vs. B comparison. Therefore, a network meta-analysis can be performed based on the differences in b0 and b1 of log hazard curves across studies. Thus, applying different p values a wide range of curve shapes can be tested and network meta-analysis of survival can be performed using a model that fits the experimental data most closely [10].
To select the best models we first digitalized survival curves for PFS and OS from the individual RCTs. The scanned Kaplan-Meier curves were divided into multiple 2-months-long consecutive intervals (Δt) over the follow-up period adjusting the data for censoring according to the method described by Jansen [10]. In each interval [t, t+Δt] in each study j and in each treatment k the number of patients at risk at the beginning of the interval (njkt) and the incident number of endpoint events (rjkt), i.e. disease progressions in case of PFS and deaths in case of OS, were calculated.
Binomial likelihood distributions were used to describe the number of endpoint events rjkt in each interval [t,t+Δt] based on njkt and pjkt:
rjkt ∼ bin(pjkt, njkt),
The hazard rate is assumed constant within the time interval, and the hazard rate hjkt is estimated using the following formula:
hjkt = −ln(1 – pjkt)/Δt
The fixed and random effects first and second order fractional polynomial models with powers chosen from the following set: -2. -1, -0.5, 0, 0.5, 1, 2 and 3 were tested. In case of the random effect models, heterogeneity parameters for both treatment parameters, i.e. d0 and d1 were considered.
The network included two three-arm study [3, 6] and the random effects model did not adjust for correlation induced by studies with more than two arms. To minimize potential influence of the possible correlation within three-arm study it was divided into two two-arm studies and the number of patients of the base treatment was split evenly between these studies [11].
A non-informative bivariate normal prior distribution was assigned to the mean of the treatment parameters of the baseline treatment in each study, and also to the difference of the treatment parameters between survival curves relative to the baseline in each study. Non-informative Wishart distribution was used for the variance of the difference in the treatment parameters between studies.
Parameters of the models were estimated using a Markov Chain Monte Carlo (MCMC) method. OpenBUGS 3.2.1 was used to conduct the analysis (http://www.openbugs.info/w/) [12]. Calculations were started with vague initial values using four chains. First 10,000 iterations with thinning set to 10 were discarded as ‘burn-in’ and results of the consecutive 25,000 iterations with the same value of thinning were used for inference. Convergence of the chains was confirmed by the Gelman-Rubin statistic. Autocorrelations and the Monte-Carlo error were also inspected.
The deviance information criteria (DIC) was used to compare the goodness-of-fit of different fixed and random effect models with different p powers [13]. For the models that were selected as those fitting the experimental PFS and OS data most closely (i.e. those with the lowest DIC values) the posterior summary of hazard rates, hazard ratios and survivals for each therapy option were derived.
The random effect model for ln(h) with a power coefficient p equal to –0.5 demonstrated the best fit to PFS experimental data. In the case of younger and fit patients the model with p equal to –2 was the best while in the case of older an unfit patients the best model was characterized by p equal to 0 (i.e. the Weibull model), meaning that log hazard was proportional to log(t).
It was found that the fixed effect first order fractional polynomial model for ln(h) with a power coefficient p equal to 2 demonstrated the best fit for OS data in the analysis network composed of all the RCTs, the trials with younger / fit patients and the trials with older / unfit patients.
The details of the analysis that had been performed are described in detail elsewhere [14].
Linki:
Referencje:
- Rai KR, Peterson BL, Appelbaum FR, et al. Fludarabine compared with chlorambucil as primary therapy for chronic lymphocytic leukemia. N Engl J Med 2000;343:1750–7.
- Eichhorst BF, Busch R, Hopfinger G., et al. Fludarabine plus cyclophosphamide versus fludarabine alone in first-line therapy of younger patients with chronic lymphocytic leukemia. Blood 2006;107:885–91.
- Catovsky D, Richards S, Matutes E, et al. Assessment of fludarabine plus cyclophosphamide for patients with chronic lymphocytic leukaemia (the LRF CLL4 Trial): a randomized controlled trial. Lancet 2007;370:230–9.
- Eichhorst BF, Busch R, Stilgenbauer S, et al. First-line therapy with fludarabine compared with chlorambucil does not result in a major benefit for elderly patients with advanced chronic lymphocytic leukemia. Blood 2009;114:3382–91.
- Hallek M, Fischer K, Fingerle-Rowson G, et al. Addition of rituximab to fludarabine and cyclophosphamide in patients with chronic lymphocytic leukaemia: a randomize, open-label, phase 3 trial. Lancet 2010;376:1164–74.
- Goede V, Fischer K, Busch R, et al. Obinutuzumab plus chlorambucil in patients with CLL and coexisting conditions. New Eng J Med 2014;370: 1101–10.
- Hillmen P, Skotnicki AB, Robak T, et al. Alemtuzumab compared with chlorambucil as first-line therapy for chronic lymphocytic leukemia. J Clin Oncol 2007;25:5616–23.
- Knauf WU, Lissitchkov T, Aldaoud A, et al. Bendamustine compared with chlorambucil in previously untreated patients with chronic lymphocytic leukaemia: updated results of a randomized phase III trial. Brit J Haematol 2012;159:67–77.
- Hillmen P, Robak T, Janssens A, et al. Ofatumumab + chlorambucil versus chlorambucil alone in patients with untreated chronic lymphocytic leukemia (CLL) Results of the Phase III Study COMPLEMENT 1 (OMB110911). Blood 2013;122: Abstract 528.
- Jansen JP. Network meta-analysis of survival data with fractional polynomials. BMC Med Res Methodol 2011;11:61.
- Higgins JPT, Green S (editors). Cochrane Handbook for Systematic Reviews of Interventions Version 5.1.0 [updated March 2011]. The Cochrane Collaboration, 2011. Available from www.cochrane-handbook.org, last accessed on February 15th, 2014.
- Lunn D, Spiegelhalter D, Thomas A, Best N. The BUGS project: Evolution, critique and future directions (with discussion). Stat Med 2009;28:3049–82.
- Spiegelhalter DJ, Best NG, Carlin BP, van der Linde A: Bayesian measures of model complexity and fit. J Royal Stat Soc, Series B 2002;64:583-639.
- Ladyzynski P, Molik M, Foltynski P: A network meta-analysis of progression free survival and overall survival in first-line treatment of chronic lymphocytic leukemia. Cancer Treat Rev, 2015 41(2):77-93.