 Polski
 English
dbnBIAL – an application that implements a dynamic Bayesian network describing progression of the B-cell chronic lymphocytic leukemia. This application makes it possible to predict changes of the health condition of a patient with CLL over a period of 25 years starting at the time of diagnosis taking into consideration available information about the patient.
Description & Graphics:
The developed application called dbnBIAL implements a dynamic Bayesian network making it possible to predict changes of the health condition of a patient with the chronic lymphocytic leukemia (CLL).
A scheme of the network implemented in dbnBIAL application for two first time slices separated by a period of 6 months is presented in figure below.
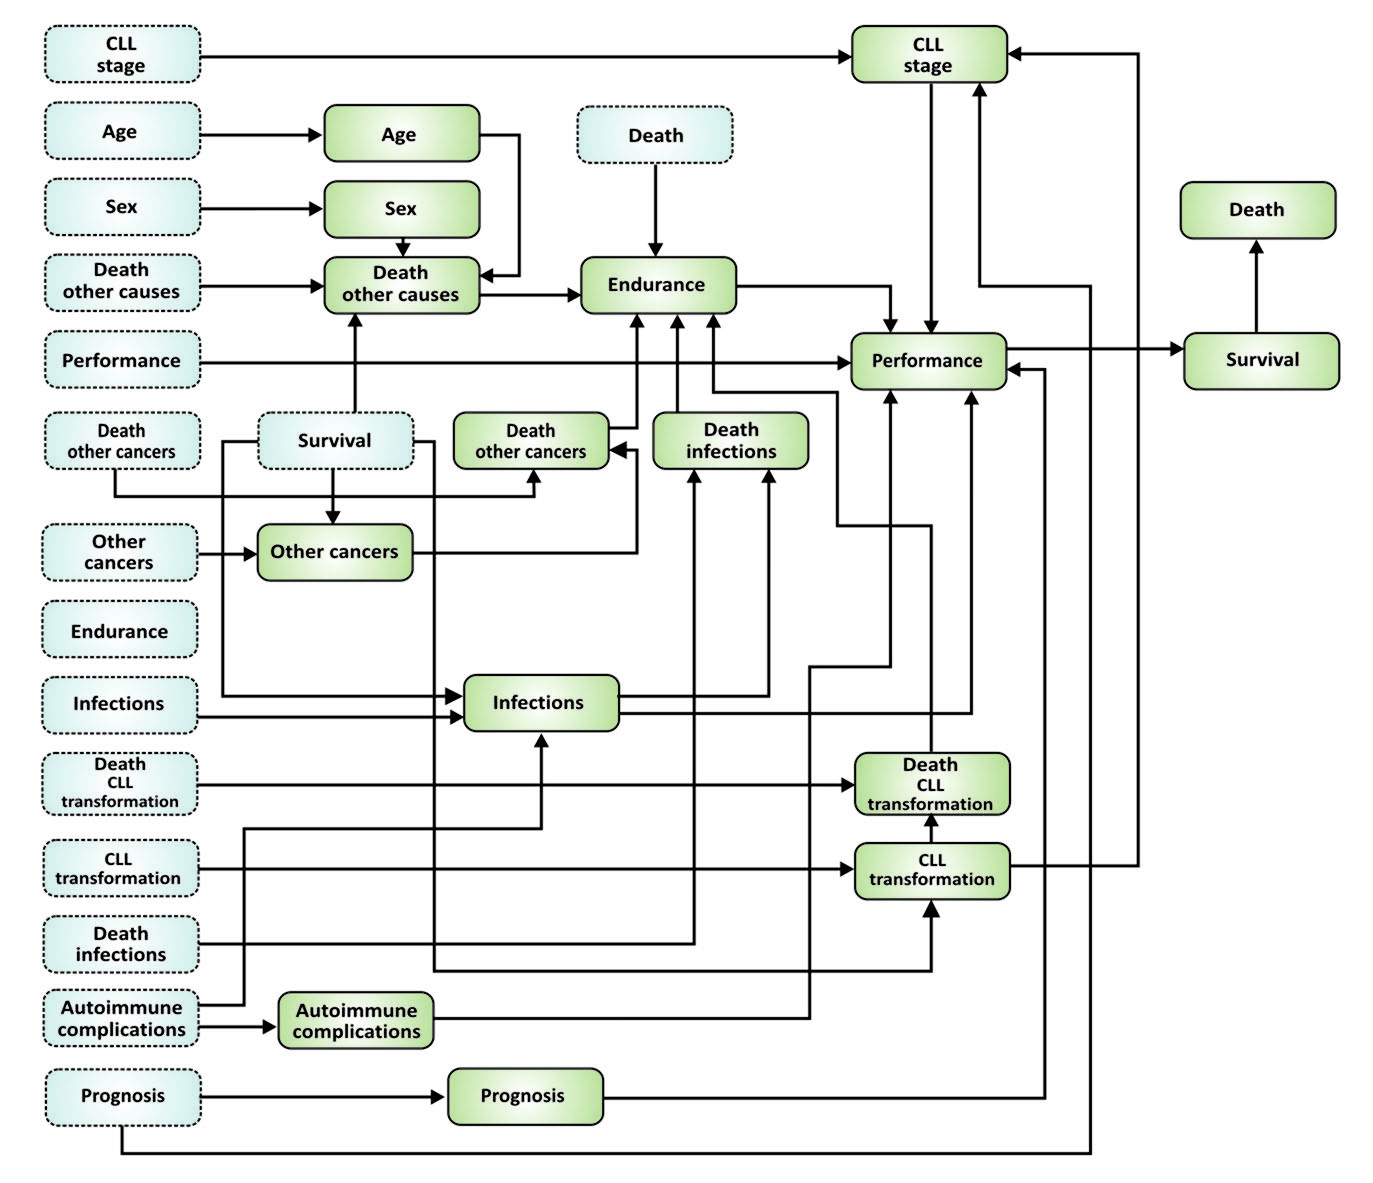
Nodes with blue background that are bounded with a dashed line represents a state of the network in the initial time, i.e. time of diagnosis, and nodes with green background that are bounded with a solid line represents the state of the network after 6 months. Tables of conditional probabilities defining connections among variables representing nodes of the network were determined based on available literature data, results collected in the database of the NetBIAL system and knowledge of the medical experts participating in the project. It is assumed that connections of nodes in the network are time invariant and thus, the network can be “unfolded” to consecutive time slices (separated by a 6 month period) to calculate changes of the state of the network in time.
The nodes of the network are described in detail below.
Prognosis, risk factors node is based on parameters determining whether a patient suffers from more or less aggressive CLL. In the implemented network it is assumed that this node can have one of three values, i.e. good, medium or poor. The prognosis is related to values of the prognostic or risk factors such as cytogenetic aberrations, mutational status of the immunoglobulin heavy-chain variable region (IgVH) and status of the selected immunophenotypic markers (e.g. CD38, ZAP70). It is assumed that good prognosis is related to a lack of cytogenetic aberrations or a presence of 13q deletion, presence of IgVH mutation and normal values of immunophenotypic markers. Medium prognosis are connected with 11q deletion or trisomy 12 and a lack of IgVH mutation. Poor prognosis is related mainly to a presence of 17p deletion, that leads to fast progression of CLL and to death within few years from diagnosis [1, 2], independently of the status of other prognostic factors as well as the stage of the disease. It is assumed that the prognosis cannot change in time. Thus, probabilities for this node are defined in the following way (t means the current time slice and t-1 – the previous time slice):
P(Prognosist = k | Prognosist-1 = k) = 1, where kÎ{good, medium, poor}
The next factor (node) that influence state of the patient is called Autoimmune complications (i.e. autoimmune hemolytic anemia and immune thrombocytopenia). Probabilities for this node are expressed in the following way:
P(Autoimmune complicationst = yes | Autoimmune complicationst-1 = yes) = 1
P(Autoimmune complicationst = yes | Autoimmune complicationst-1 = no) = x
Where x means a value of probability estimated based on currently available data sources.
CLL transformation into more aggressive forms of leukemia, mainly into Richter syndrome, is rare and occurs in about 5% of patients [3]. These patients survive in average approx. 3 years. Probabilities for values yes and no for nodes called CLL transformation and Death transformation (which means that transformation was the direct cause of patient’s death) are defined as follows:
P(CLL transformationt = yes | CLL transformation t-1 = yes, Survivalt-1 = k) = 1, where k Î {yes, no}
P(CLL transformationt = yes | CLL transformation t-1 = no, Survivalt-1 = yes) = x1
P(CLL transformationt = yes | CLL transformation t-1 = no, Survivalt-1 = no) = 0
P(Death transformationt = yes | Death transformationt-1 = yes, CLL transformationt = k) = 1, where k Î {yes, no}
P(Death transformationt = yes | Death transformationt-1 = no, CLL transformationt = yes) = x2
P(Death transformationt = yes | Death transformationt-1 = no, CLL transformationt = no) = 0
Patients with CLL are susceptible to infections because of the lowered immunity. At diagnosis approx. 15% of patients suffers from infections of different origins and this percentage is growing up to approx. 30% due to advancement of CLL, patients’ age and decreasing immunity. Probabilities of Infections is defined as follows:
P(Infectionst = yes Infectionst-1 = k, Survivalt-1 = yes) = xk, where k Î {yes, no}
P(Infectionst = yes | Infectionst-1 = yes, Survivalt-1 =no) = 1
P(Infectionst = yes | Infectionst-1 = no, Survivalt-1 = no) = 0
Death caused by infections (node: Death infections) is pretty common in patients with CLL and it is the direct cause of death in case of approx. 30% of all patients. Probabilities related to this node of the network are as follows:
P(Death infectionst = yes | Death infectionst-1 = yes, Infectionst = k) = 1, gdziek Î {yes, no}
P(Death infectionst = yes | Death infectionst-1 = no, Infectionst = yes) = x
P(Death infectionst = yes | Death infectionst-1 = no, Infectionst = no) = 0
Patients with CLL might suffer from Other cancers. Other cancers are present in approx. 20% patients during diagnosis of CLL and after 25 years up to 50% of all patients with CLL suffer from other cancers [3]. Probabilities for Other cancers node are defined as follows:
P(Other cancerst = yes | Other cancerst-1 = k, Survivalt-1 = yes) = x, where k Î {yes, no}
P(Other cancerst = yes | Other cancerst-1 = yes, Survivalt-1 = no) = 1
P(Other cancerst = yes | Other cancerst-1 = no, Survivalt-1 = no) = 0
Other cancers are the direct cause of death in case of approx. 30% patients (node: Death other cancers). Probabilities for this node that are used in the network are defined as follows:
P(Death other cancerst = yes | Death other cancerst-1 = yes, Other cancerst = k) = 1, gdzie k Î {yes, no}
P(Death other cancerst = yes | Death other cancerst-1 = no, Other cancerst = yes) = x
P(Death other cancerst = yes | Death other cancerst-1 = no, Other cancerst = no) = 0
Some of patients with CLL dies from other causes than those listed above, which are not directly related to CLL. Probability of death from other causes (node: Death other causes) depends on patient’s age and sex. For simplicity, patients were divided into two groups depending on their age (those aged 65 years or less and those older than 65 years) and probabilities of death from other causes was defined accordingly:
P(Death other causest = yes | Death other causest-1 = yes, Sext = k, Aget = i) = 1, where k Î {Male, Female}, i Î {> 65 years, <= 65 years}
P(Death other causest = yes | Death other causest-1 = no, Sext = k, Aget = i) = xki where k Î {M, K}, iÎ{> 65 years, <= 65 years}
Probabilities for Death other causes node estimated based on the available statistical data are presented below.
| Death other causest-1 | Sext | Aget | Death other causest | |
| yes | M | >65 | yes | 1 |
| no | M | >65 | yes | 0.0042 |
| yes | F | >65 | yes | 1 |
| no | F | >65 | yes | 0.0028 |
| yes | M | <=65 | yes | 1 |
| no | M | <=65 | yes | 0.00024 |
| yes | F | <=65 | yes | 1 |
| no | F | <=65 | yes | 0.0001 |
| yes | M | >65 | no | 0 |
| no | M | >65 | no | 0,9958 |
| yes | F | >65 | no | 0 |
| no | F | >65 | no | 0.9972 |
| yes | M | <=65 | no | 0 |
| no | M | <=65 | no | 0.99976 |
| yes | F | <=65 | no | 0 |
| no | F | <=65 | no | 0.9999 |
Death caused by CLL transformation, infections, other cancers and other causes influences Endurance of the patient. Probabilities for this node are defined in the following way:
P(Endurancet = yes | Endurancet-1 = yes, Death tarnsformationt = no, Death infectionst = no, Death other cancerst = no, Death other causest = no) = 1
P(Endurancet = yes | Death transformationt = k1, Death infectionst-1 = k2, Death other cancerst = k3, Death other causest = k4) = 0, where ki = yes for one i Î {1, 2, 3, 4}
In the developed network the Rai staging system is used to characterize state of CLL in a node called CLL stage. Three values for this node are considered: stage 0, stage I or II and stage III or IV. At diagnosis percentages of patients in each stage are as follows: stage III or IV – 39%, stage I or II – 56% and stage 0 – 5%. Some patients with CLL in stages I, II, III and IV have chance for remission as a result of the applied treatment, which might result in temporal improvement of the state of CLL. In the remaining group of patients the disease is progressing with time, which leads to deterioration of the patient’s condition and finally – to death. Conditional probabilities characterizing this node of the network are defined as follows:
P(CLL staget = III, IV | Prognosist-1 = k, CLL staget-1 = i, CLL transformationt = yes) = 1 where kÎ{good, medium, poor}, iÎ{III,IV; I,II; 0}
P(CLL staget = i | Prognosist-1 = k, CLL staget-1 = i, CLL transformationt = no) = xki where kÎ{good, medium, poor}, iÎ{III,IV; I,II; 0}
Patients’ general well-being and activities of daily life (node: Performance) is characterized using ECOG performance status, in which state 0 characterizes fully active patients, able to carry on all predisease activities without restriction and state 5 means – death. For simplicity Performance has three possible states: good (ECOG: 0,1,2), medium (ECOG: 3,4) and death (ECOG: 5). Performance depends on: stage of CLL, prognosis, infections and autoimmune complications. Probabilities for Performance node are defined in the following way:
P(Performancet = good | Performancet-1 = i, Prognosist = j, Autoimmune complicationst = k, CLL staget = m, Infectionst = k, Endurancet = k) = ((((pij)k)m)k)k where i Î {good, medium}, j Î {good, medium, poor}, k Î {yes, no}, m Î {III,IV; I,II; 0}
P(Performancet = k | Performancet-1 = death) = 0 where k Î {good, medium}
Survival of the patient with CLL is possible when Performance node is not equal to death:
P(Survivalt = yes | Performancet ≠ death) = 1
There is also Death node defined in the network. Its value is opposite to the value of Survival
P(Deatht = yes | Survivalt = no) = 1
P(Deatht= yes | Survivalt = yes) = 0
It is necessary to estimate all the probabilities for two consecutive time slices, which are separated by a period of 6 months. If there are data available showing for example that after 25 years infections affect 30% of all patients then this information can be utilized to calculate the probability for two consecutive time slices using the following formula [4]:
![]()
Where Pm means probability for two consecutive time slices separated by m months, n is time span for which the probability Pn is known. For the above-mentioned example, n = 300, m = 6, Pn = 0.3 and the probability in question Pm is equal to 0.007.
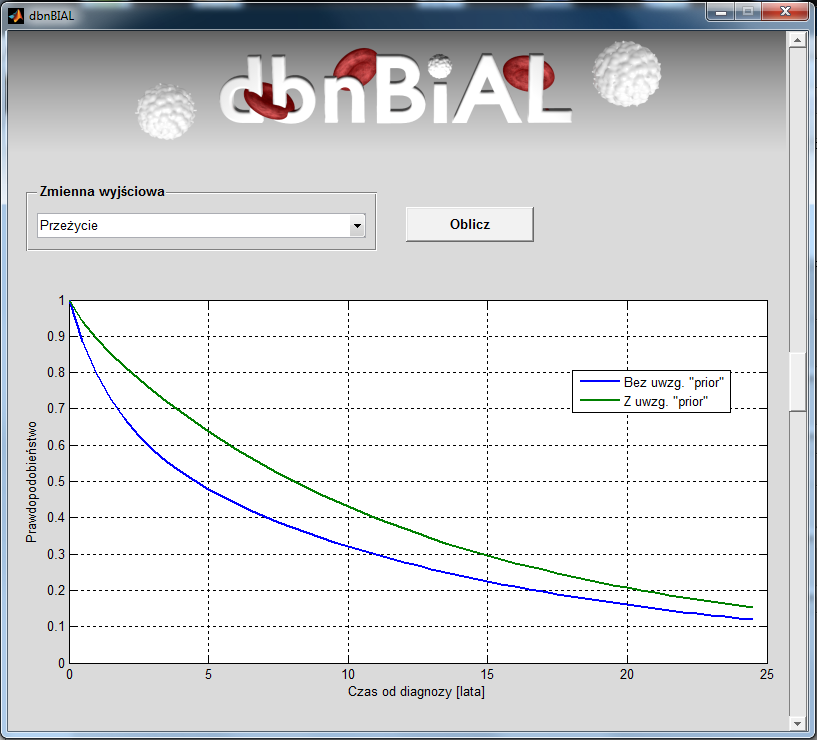
An exemplary results of simulation for male patient with PBL in stage 0 who was over 65 at the time of diagnosis.
Linki:
- Install version of the developed dbnBIAL simulator compiled for MS Windows operating system can be downloaded: http://dbnbial.ibib.waw.pl/MyAppInstaller_dbnBIAL.exe
Referencje:
1. F. Van Bockstaele, B. Verhasselt, J. Philippe – Prognostic markers in chronic lymphocytic leukemia: A comprehensive review. Elsevier. Blood Reviews (2009) 23, 25-47.
2. G. Dighiero, T. J. Hamblin – Chronic lymphocytic leukemia. Lancet 2008; 371: 1017-29.
3. Przewlekła białaczka limfatyczna. Czas na zmianę standardów postępowania? – Andrzej Deptała, wykład – http://tip.wum.edu.pl/files/tip/Przewlekla_bialaczka_limfatyczna.pdf
4. M. van Gerven, B. Taal – Structure and parameters of a Bayesian network for carcinoid prognosis.